Monitoring Java Application Security with JDK tools and JFR Events
JFR Security Events Overview
Monitoring the underlying security configuration of your Java application offers you insights on its overall strength
with respect to cryptographic standards. JDK 12 introduced four JDK Flight Recorder(JFR) Security Events, disabled by default in the default.jfc
and profile.jfc JFR configuration files:
jdk.SecurityPropertyModificationto recordSecurity.setProperty(String key, String value)method callsjdk.TLSHandshaketo keep track of TLS handshake activityjdk.X509Validationto record details of X.509 certificates negotiated in successful X.509 validationjdk.X509Certificateto record details of X.509 Certificates.
These events were also backported to Oracle JDK 11.0.5 and 8u231 update releases. You can enable these events by modifying the JFR configuration files or via standard JFR options. Take a look at the JDK Flight Recorder series and learn how to configure it to capture JVM relevant events.
Another two JFR cryptographic events offer insights on initial JDK security properties (jdk.InitialSecurityProperty) and the amount of
service provider method invocations (jdk.SecurityProviderService). JDK 20 release announced the new jdk.InitialSecurityProperty and it was backported to
Oracle JDK 17.0.7 and 11.0.20 update releases. jdk.SecurityProviderService event is also available since JDK 20 release, but also in the code base of JDK 17.0.8, 11.0.22 and 8u391 update releases.
This tutorial aims show you how to use how to utilize these JFR Security Events and other JDK tools (keytool, JDK Flight Recorder, JDK Mission Control) to monitor the security of your Java application.
Observing JDK Security Properties
The jdk.InitialSecurityProperty was introduced in JDK 20 to record details of initial security properties when loaded via the java.security.Security class.
You can also print the initial security properties to the standard error stream if you set the java.security.debug=properties system property:
The jdk.InitialSecurityProperty event is enabled by default in the default.jfc and profile.jfc JFR configuration files.
If you enable the jdk.SecurityPropertyModification event and keep jdk.InitialSecurityProperty enabled, you can use a JFR recording to monitor the initial settings of all security properties and any subsequent changes.
There are several ways to get a complete view of changes over JDK security properties, including the service provider invocations:
- Have also
jdk.SecurityPropertyModificationandjdk.SecurityProviderServiceenabled in JFR configuration
- Add the
-XX:StartFlightRecordingflag with default settings, whilejdk.SecurityPropertyModificationandjdk.SecurityProviderServiceare enabled
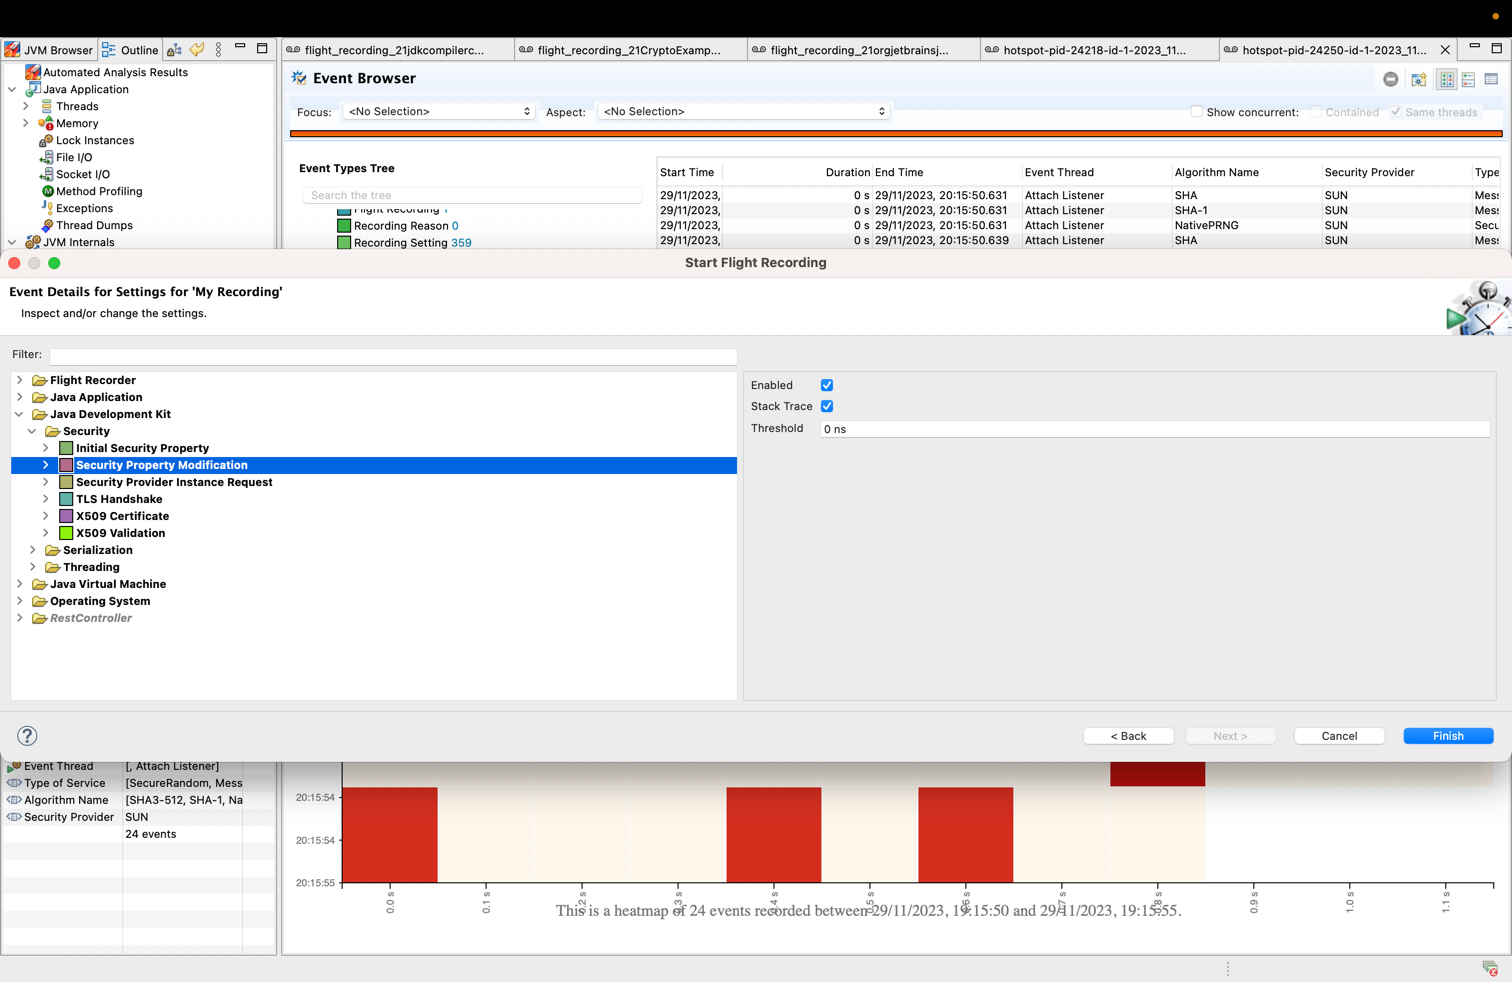
- Start a JFR recording from JDK Mission Control (JMC) by establishing a connection to a running JVM and configuring the events.
Go to JDK Mission Control (JMC) menu, select
File > Connection... > [Select one running JVM] > Start Flight Recordingand configure each JDK Security event.
You can start a recording from JDK Mission Control (JMC) or in the command line by:
- running java with
-XX:StartFlightRecordingor - execute a diagnostic command via
jcmdtool
Once you have a ".jfr" recording file, you can print the events using jfr JDK tool:
By analyzing the output of this command, you can observe the changes that occurred for each security property between its initials values captured by jdk.InitialSecurityProperty and the changes from jdk.SecurityPropertyModification event.
For example, the jdk.InitialSecurityProperty captured keystore.type as initially set to pkcs12, and later jdk.SecurityPropertyModification recorded its value to jks.
You can also inspect and visualize the evolution of captured events in JDK Mission Control by loading the recording file and navigating to the Event Browser > Java Development Kit > Security section:
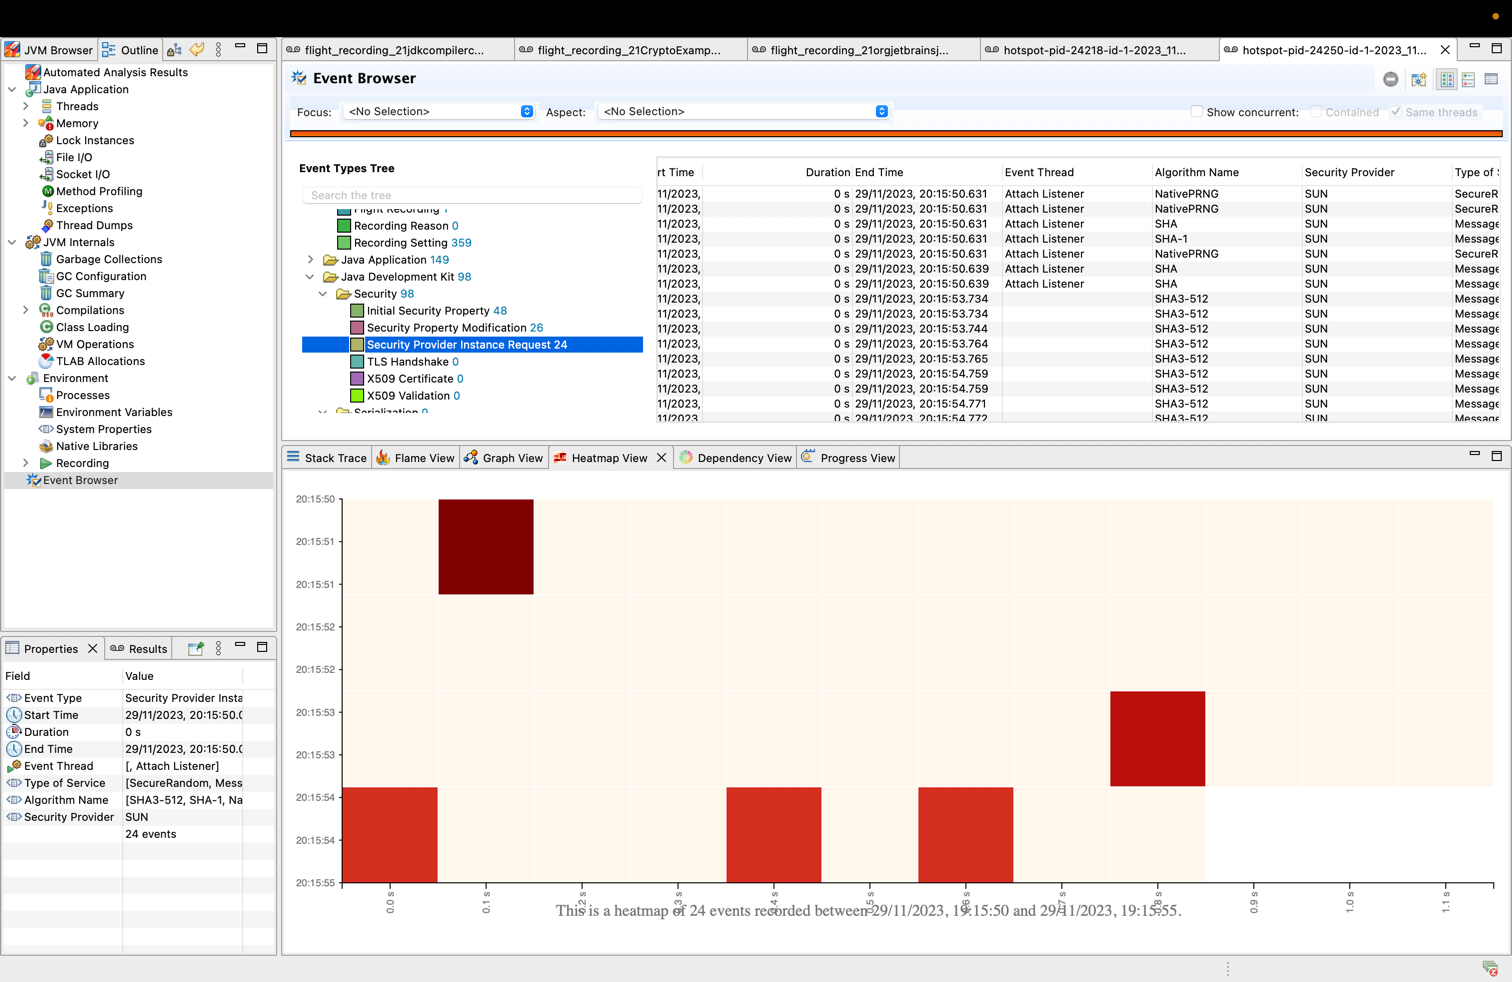
Apart from the table display of events, JMC offers performance analysis insights via its views:
- Flame view renders aggregated stack trace collected by the JFR events.
- Graph view renders aggregate stack traces with cumulative count. It presents the stack trace in a graphical format, which helps identify method path to its root.
- Heatmap view provides a visual representation of events occurred during a specific time period within the stacktrace.
- Dependency view presents aggregation of events using hierarchical edge bundling and helps in visualizing the dependencies between packages.
If you are wondering what Transport Layer Security(TLS) protocol version your Java application is using, that depends on how your JDK and applications are configured.
In the most recent JDK releases, TLSv1.3 and TLSv1.2 are the default options.
Determining precisely what TLS protocol version an application uses is most straightforward by collecting runtime data. Various tools and logger options are available and the next section will discuss some of those.
Monitoring TLS Protocol
To capture TLS protocol information, one could attach a network protocol analyzer tool to the network interface where the running JVM communicates, and get information on all the network traffic. Look for the "Server Hello" record and the accompanying version value to determine the TLS version used on a particular socket.
But a more Java developer friendly way to check TLS protocol version is by inspecting the JDK debug logs.
If you enable javax.net.debug system property to ssl:handshake (i.e. -Djavax.net.debug=ssl:handshake), you will obtain the TLS version protocol value.
Below is an example of a ServerHello capture in a recent JDK 21 release:
The above output shows that TLSv1.3 is in use for this particular connection ("selected version": [TLSv1.3]).
In the long run, inspecting logs can be a tedious task, so a valuable option for capturing essential TLS information is via JDK Flight Recorder.
The jdk.TLSHandshake event captures core information on every TLS handshake performed by the JDK. To enable it, you can perform the following:
- Simply switch the
jdk.TLSHandshakeoptions totruein your JFR configuration file:
- Run
jfr configurecommand in a terminal window
- Add the
-XX:StartFlightRecordingflag with default settings, whilejdk.TLSHandshakeis enabled as well:
- Start a JFR recording from JDK Mission Control (JMC) by establishing a connection to a running JVM and configuring the event.
Go to JDK Mission Control (JMC) menu, select
File > Connection... > [Select one running JVM] > Start Flight Recordingand configurejdk.TLSHandshakeevent.
You can start a recording from JDK Mission Control (JMC) or in the command line by:
- running java with
-XX:StartFlightRecordingor - execute a diagnostic command via
jcmdtool
As soon as you obtain a recording, you can analyze the TLSHandshake event data with jfr or in JDK Mission Control.
For example, running the following jfr print command will show you the TLS handshake activity:
You can observe in the output the following event fields:
- Peer hostname
- Peer port
- TLS protocol version negotiated
- TLS cipher suite negotiated
- Certificate id of peer client
While Transport Layer Security (TLS) is a cryptographic protocol designed to support secure communications over a computer network, digital certificates ensure that data is transmitted privately and without modifications, loss or theft. Next section discusses how you can record and analyze X.509 certificates details.
Analyzing X.509 certificates
X.509 certificates are widely deployed in JDK applications to support authentication and other functionality in security systems. An X.509 certificate has a set of fields defined according to [RFC 1422] and include:
- version
- serial number
- signature (algorithm ID and parameters)
- issuer name
- validity period
- subject name
- subject public key (and associated algorithm ID)
The values of these fields impact the underlying security configuration in the environments where they are used. For example, the validity period of a certificate is an essential piece of data as expired certificates can cause application downtime from a specific date onward.
From a static analysis point of view, you can use the keytool to query certificates.
For example, you can view verbose details about every certificate inside the default JDK truststore ($JDK_HOME/lib/security/cacerts in JDK 9 and later) by running the following command:
The above scenario is simple, but how can you retrieve details of certificates that are actually in use for a Java application?
By configuring the debug system properties -Djava.security.debug=certpath and -Djavax.net.debug=all to print verbose X.509 certificate information during the lifetime of a Java application.
Below you can see a sample output of X.509 certificates printed during certificate path validation attempts:
Yet verbose logging slows down systems because of the time needed to collect additional information or display additional details. You can elegantly capture relevant data about X.509 certificates using two JDK Flight Recorder security events:
jdk.X509Validationthat records details of X.509 certificates negotiated in successful X.509 validations.jdk.X509Certificatethat captures information about every X.509 cert generated by the JDK security libraries.
You have several options to enable these events:
- Simply switch the
jdk.X509Certificateoptions totruein your JFR configuration file:
- Run
jfr configurecommand in a terminal window
- Add the
-XX:StartFlightRecordingflag with default settings, whilejdk.X509Certificateandjdk.X509Validationare enabled as well:
- Start a JFR recording from JDK Mission Control (JMC) by establishing a connection to a running JVM and configuring the event.
Go to JDK Mission Control (JMC) menu, select
File > Connection... > [Select one running JVM] > Start Flight Recordingand configurejdk.X509Certificateandjdk.X509Validationevents.
You can start a recording from JDK Mission Control (JMC) or in the command line by:
- running java with
-XX:StartFlightRecordingor - execute a diagnostic command via
jcmdtool
For example, running the following command will show you recorded details about X.509 Certificates:
JDK Flight Recorder provides rich, structured data,like stack traces and timestamped values, and API support to event streams.
Until JDK 16, developers could monitor a Java process on a remote host and control what is recorded via JDK Mission Control.
JDK Mission Control fetches recording data and configures events on a remote machine using FlightRecorderMXBean.
Starting with JDK 16, you can transfer recorded events programmatically over the network as they occur using an MBeanServerConnection:
So utilize the JDK tools and APIs available with your JDK version and analyze security settings and certificate data at runtime to keep your application safe!
Useful Links:
More Learning
Last update: December 1, 2023